· Case Study · 13 min read
Observability as a dependency : Spring Boot, OpenTelemetry and Cloud Run
From two tracing stacks to one Maven dependency for an ~80-service Spring Boot fleet 🔭
A request comes in, calls a second service, reads MongoDB, and is slow. Which part was slow, and what did each service log while it happened ? On Google Cloud, the answer is one click away : Cloud Trace shows the request as a tree of spans, and Cloud Logging lists every log line filed under the same trace. That click only works if every service sends its spans, tags its log lines with the trace, and does both the same way.
In May, when we wrote down the state of the fleet before migrating it, no two services did it the same way. Today one Maven dependency does it for them, and a service carries no Google Cloud code at all. Here is how, and what Cloud Run taught us along the way.
Everything below runs in spring-gcp-observability : one starter, two services on Cloud Run, Terraform, and the screenshots of this post.
Where we started
The study of the legacy had one line per problem : the current state, a proposal, a gain, a cost. Two lines were about observability.
- Tracing. Two stacks lived side by side in the shared parent : OpenCensus 0.31.1, end of life and archived, and OpenTelemetry 0.33.0. One service had moved to OpenTelemetry. The others still exported through OpenCensus’s Stackdriver exporter, and each one initialized its tracer by hand, in
main(). - Logs. A
logback.xmlshipped inside a shared library jar, writing through Google’s logging appender, behind a custom logger wrapper. Every service that depended on the library got that file on its classpath, whether it wanted it or not.
Both are the same mistake seen from two sides. Tracing left every decision to the service, so every service decided differently. Logging took every decision away, through a jar nobody could override. What we needed sat in between : a default any service can set back.
One dependency, nothing Google in the service
A service declares what it is. The platform decides how it is observed.
In the public repo, a service’s whole contribution to its own observability is this :
<dependency> <groupId>com.vspiewak</groupId> <artifactId>observability-starter</artifactId></dependency>spring: application: name: "orders-api" mongodb: uri: "mongodb://localhost:27017" database: "orders"pricing: url: "http://localhost:8081"A name, a database, where the next service lives. No tracer, no exporter, no log appender.
The starter reads one property, spring.cloud.gcp.project-id, Spring Cloud GCP’s own, and does not care where it comes from. Without it, a laptop gets plain console logs with the trace id in them, and exports nothing. With it, the same jar logs JSON for Cloud Logging and sends its spans to Cloud Trace. In the fleet it is a per-environment mandate : a value the platform sets, that no service can override, and the deployment only picks the profile. The demo has no environments, so Terraform passes it as SPRING_CLOUD_GCP_PROJECT_ID. Set it in one place only : a mandate sits above environment variables, so on a fleet service the variable would be ignored.
Under the hood, the starter is Spring Boot’s own spring-boot-starter-opentelemetry plus four small classes and two YAML files. The YAML is loaded by an EnvironmentPostProcessor below the service’s application.yaml, so every default in it can be set back by the service. The classes do what properties cannot. In the code, spans are Micrometer’s and nothing Google-specific : @Observed on a class traces its public methods, and an Observation wraps any block that deserves a span of its own.
Traces : plain OTLP to Google
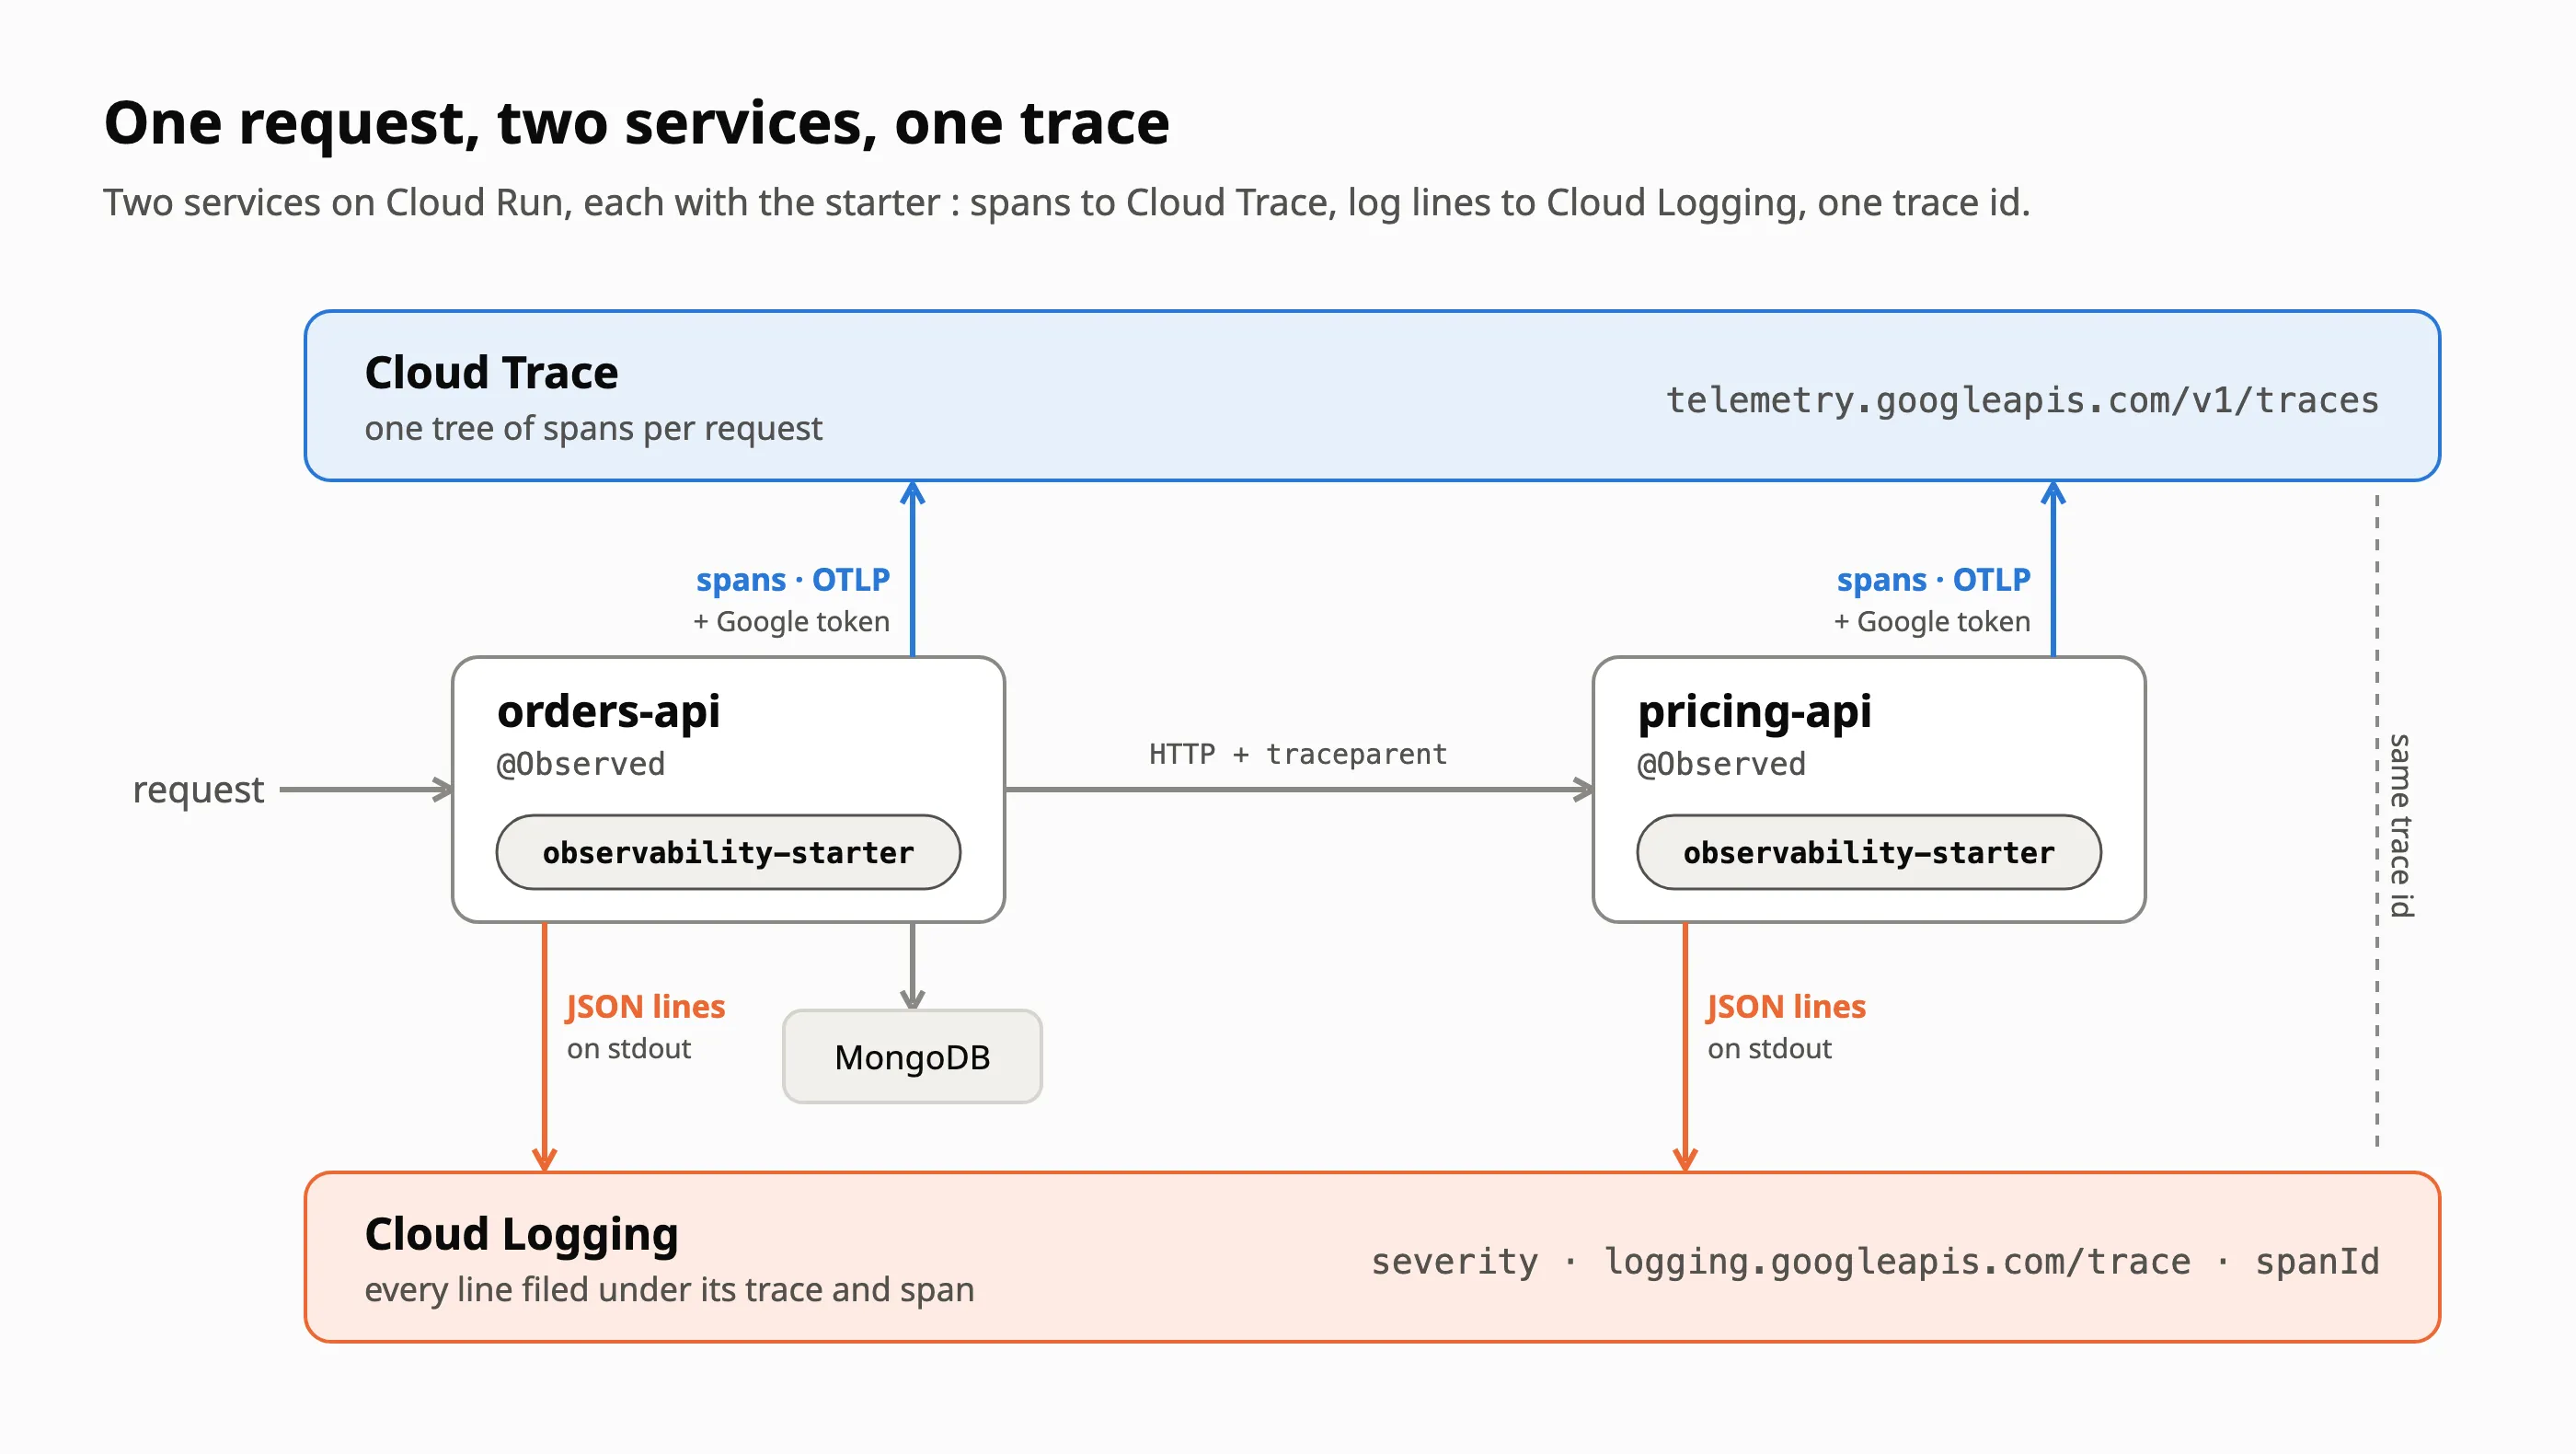
Boot already traces HTTP requests and exports them over OTLP. What it cannot know is Google’s side, and the starter adds exactly three things :
- Where :
https://telemetry.googleapis.com/v1/traces, the Telemetry API’s OTLP endpoint. One line of YAML. - Whose : a
gcp.project_idresource attribute on every span, the key the Telemetry API files spans under. One line too. - A token, on every export : the only Google-specific bean.
@AutoConfiguration(afterName = "com.google.cloud.spring.autoconfigure.core.GcpContextAutoConfiguration")@ConditionalOnProperty("spring.cloud.gcp.project-id")@ConditionalOnBean(CredentialsProvider.class)public class CloudTraceAutoConfiguration {
  @Bean  public OtlpHttpSpanExporterBuilderCustomizer googleCloudAuthentication(CredentialsProvider credentialsProvider) {    Supplier<Credentials> credentials = SingletonSupplier.of(() -> credentials(credentialsProvider));    // a supplier, not a value : a token expires, so the headers are read again on every export    return builder -> builder.setHeaders(() -> authorization(credentials.get()));  }}
The credentials are Spring Cloud GCP’s, the same ones its Secret Manager or Pub/Sub starters use. Google’s opentelemetry-gcp-auth-extension would have been the obvious choice, but it hooks into the OpenTelemetry Java agent or the SDK’s own autoconfiguration, and Boot builds the SDK from beans instead.
Two things we did not keep. The study had proposed Spring Cloud GCP’s trace starter : it is built on Brave and Zipkin over gRPC, not on the OpenTelemetry bridge Boot exports from, and it follows Cloud Run’s sampling decision, which matters more than it sounds, as the next section shows. And the first version at work, shipped in May, exported through Google’s dedicated Cloud Trace exporter ; in September we replaced it with the plain OTLP export above, in one library release. One exporter less to maintain, and the standard protocol any OpenTelemetry collector also reads.
Why no Collector ? For Cloud Run, Google recommends an OpenTelemetry Collector as a sidecar next to each service. Across ~80 services, a sidecar is one more container per service to configure, deploy and upgrade, while the export needs one bean in a starter they already share. A Collector earns its place with processing in one place, several destinations, or tighter control of the pipeline, and switching later is cheap once the export is already OTLP. The demo’s otel-collector branch makes that switch : neither service changes, the starter loses its token bean and Spring Cloud GCP, and Terraform adds the sidecar. It works, though on the demo the sidecar added a few seconds to each cold start. We have not benchmarked the two under load.
A sampler that ignores Cloud Run’s decision
Cloud Run hands every request a W3C traceparent, but records at most 0.1 request per second per instance : most requests arrive flagged not sampled. Boot’s default sampler is parent-based, so it obeys the flag and drops the service’s spans, whatever management.tracing.sampling.probability says. A fleet can set the probability to 100% and still see almost nothing.
The starter samples on the trace id alone :
management: opentelemetry: tracing: sampler: "trace-id-ratio" tracing: sampling: probability: 1.0Six requests in a burst to the deployed service, on 2026-10-06 :
| Cloud Run sampled it | orders-api spans in Cloud Trace | |
|---|---|---|
| request 1 | yes | 4 |
| requests 2 to 6 | no | 4 each |
With Boot’s default, requests 2 to 6 leave no trace at all. The demo keeps every trace, to make the behaviour visible ; at work the same sampler runs at 10%, a decision the service’s own trace id makes, not Cloud Run. Both lines are defaults, and a service that wants Cloud Run’s decision back sets them in its own application.yaml.
Logs filed under their trace
Boot writes structured JSON logs on its own (ecs, gelf, logstash), but not in Google’s format. The starter turns logstash on and adds the three fields Cloud Logging reads :
members.add("severity", ILoggingEvent::getLevel).as(level -> level == Level.WARN ? "WARNING" : level.toString());members.add("logging.googleapis.com/trace", event -> event.getMDCPropertyMap().get("traceId")) .whenHasLength() .as(this.tracePrefix::concat); // "projects/<project>/traces/", the form Cloud Run's request logs usemembers.add("logging.googleapis.com/spanId", event -> event.getMDCPropertyMap().get("spanId")) .whenHasLength();severity is Google’s name for the level. The trace takes the same form as Cloud Run’s own request log, so both land under one trace, and the span id puts each line on its span. At work this format was written by a teammate. Open OrderService#findByOrderId in Cloud Trace and its log line is there :
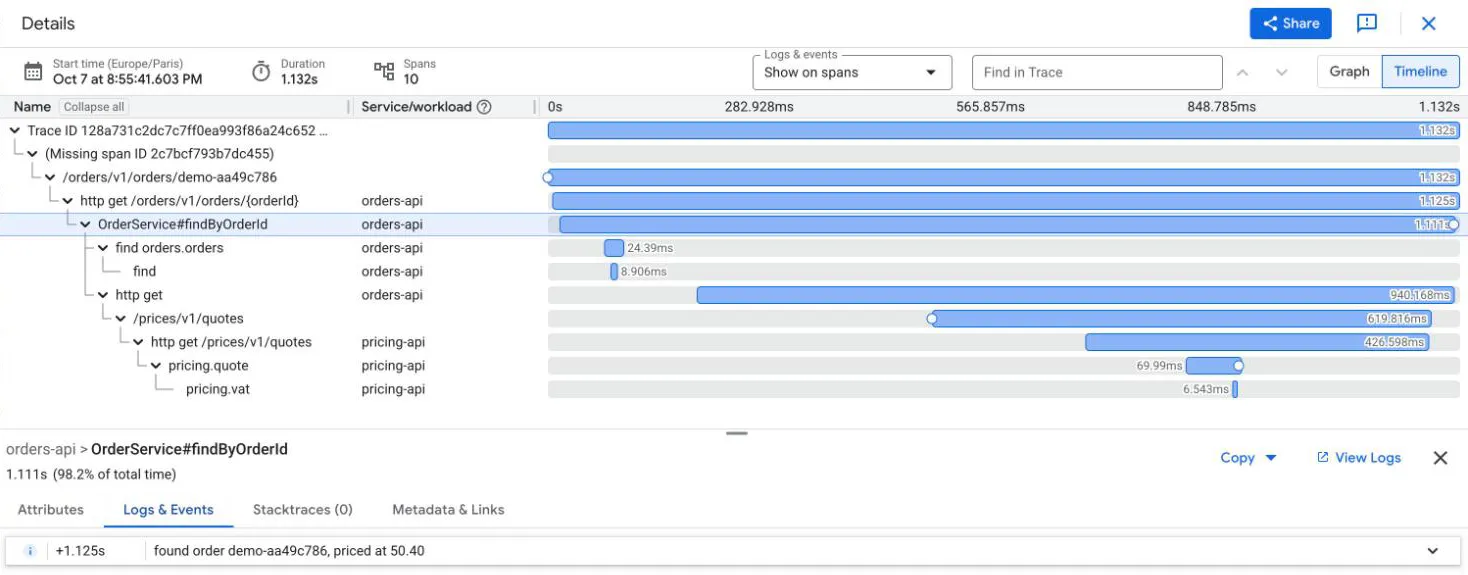
And the Logs Explorer, queried by trace=, lists both services’ lines for that one request : the two Cloud Run request logs, then pricing-api’s line and orders-api’s.
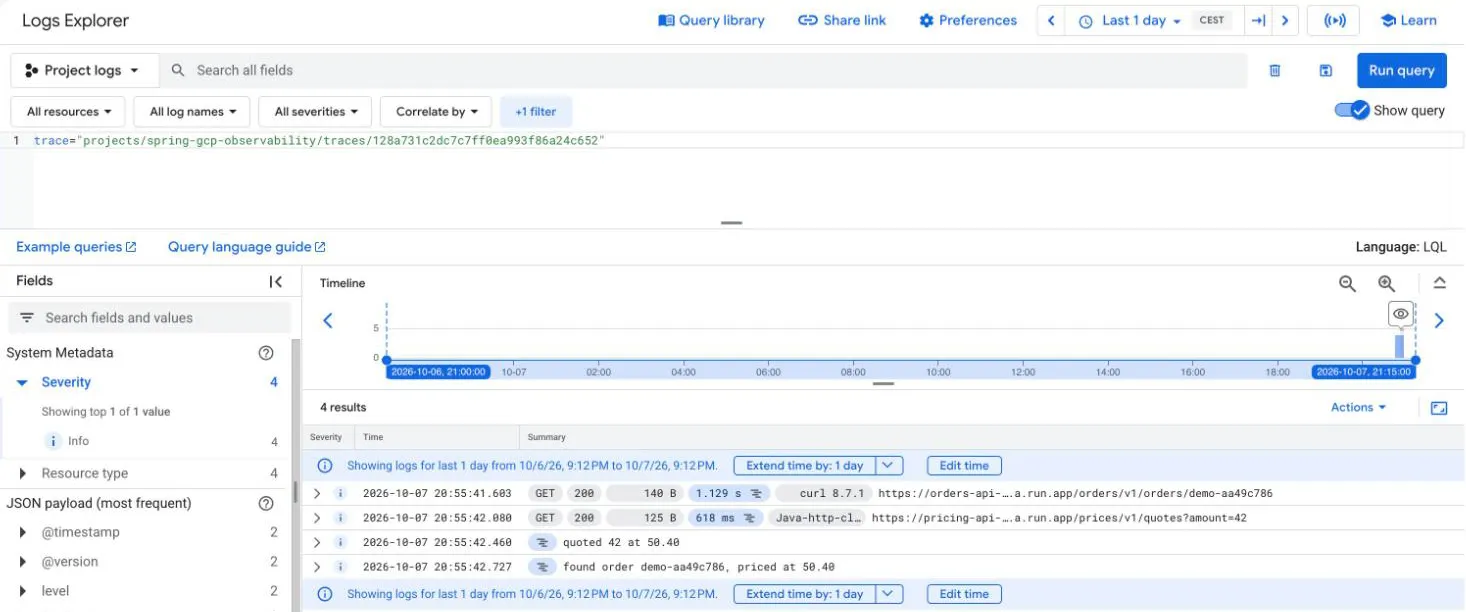
One request, one trace, two services
Nothing in the services propagates the trace. Boot instruments the RestClient.Builder it hands out, so orders-api’s call to pricing-api gets a client span and carries a traceparent, and pricing-api continues it. The MongoDB driver traces itself once it is handed an ObservationRegistry, which Boot does not do and the starter does, with query payloads left out.
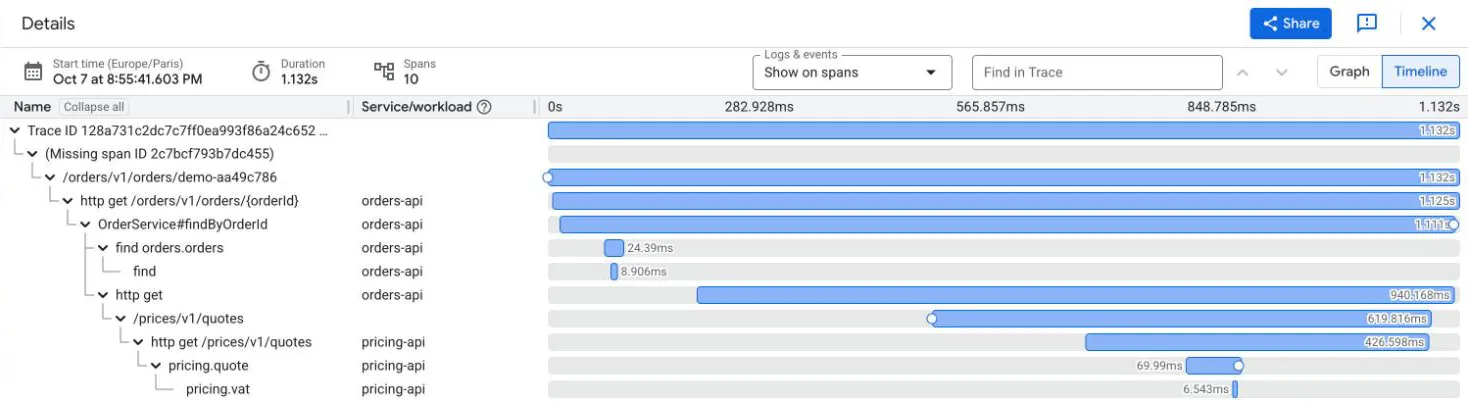
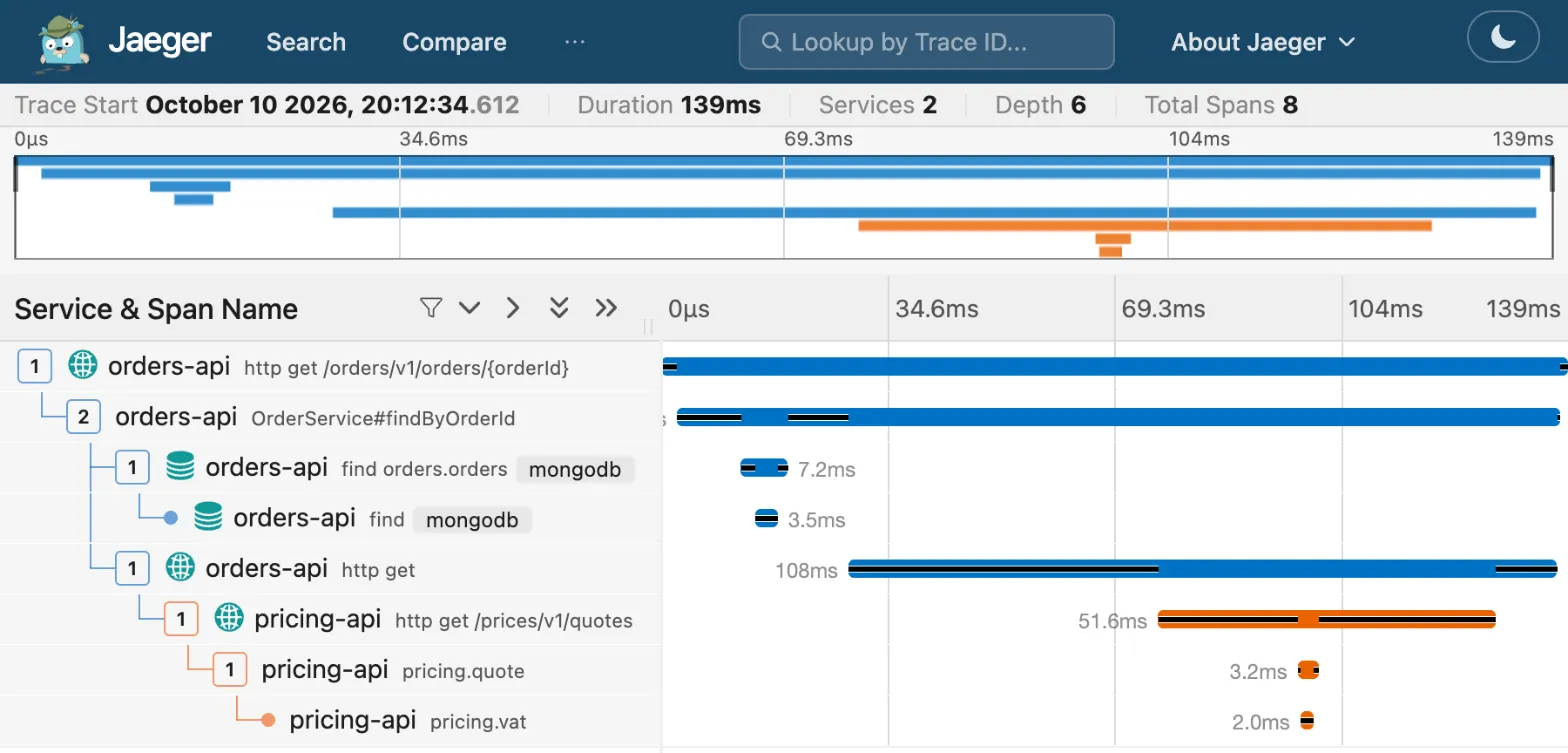
/orders/v1/orders/demo-aa49c786 ← Cloud Run's front end└─ http get /orders/v1/orders/{orderId} ← orders-api └─ OrderService#findByOrderId ← @Observed ├─ find orders.orders ← the MongoDB driver │ └─ find └─ http get ← the call to pricing-api └─ /prices/v1/quotes ← Cloud Run's front end, again └─ http get /prices/v1/quotes ← pricing-api └─ pricing.quote ← @Observed on a method └─ pricing.vat ← a span of its ownSeven of these ten spans come without writing tracing code : Cloud Run’s and the HTTP ones come from the platform and Boot, the MongoDB ones from the starter. The services write the other three, each a different way :
// 1. every public method, named Class#method@Service@Observedpublic class OrderService { ... }
// 2. one method, under the name you choose@Observed(contextualName = "pricing.quote")public Quote quote(int amount) {  ...  // 3. one block  var vat = Observation.createNotStarted("pricing.vat", observationRegistry)      .lowCardinalityKeyValue("vat.rate", VAT_RATE.toPlainString())      .observe(() -> net.multiply(VAT_RATE).setScale(2, RoundingMode.HALF_UP));  ...}
The first is the quickest start. The fleet asks for the second, with a name, and a build check enforces it further down.
What Cloud Run taught us
Measured on the demo, Spring Boot 4.1 on Cloud Run, in October 2026 :
- Throttled CPU loses spans. Spans leave in batches, after the response. With Cloud Run’s default request-based CPU, the export failed (
Failed to export spans. The request could not be executed.) and the batch was gone. Withcpu_idle = false, the same idle request’s spans arrived within 20 seconds. - Every trace starts with a “Missing span ID”. For a request it chose not to sample, Cloud Run still names its own span as the parent, and never records it : the service’s spans hang under a placeholder. When Cloud Run does sample, the placeholder moves up one level, above Cloud Run’s span.
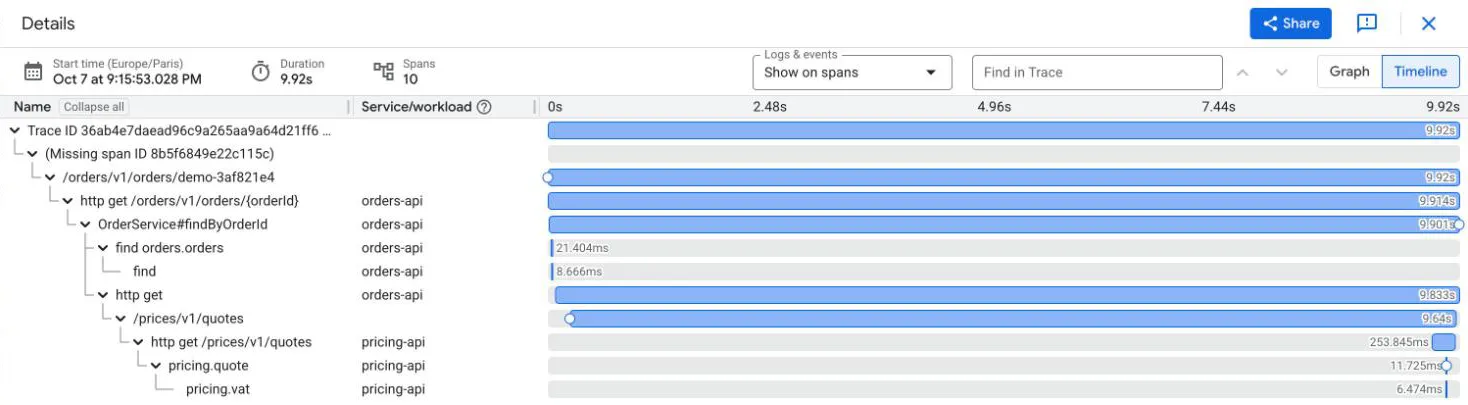
- The trace shows the cold start. After about fifteen minutes without traffic, both services had scaled to zero. The next call to pricing-api took 9.8 seconds, of which pricing-api itself spent 254 ms. The rest is Cloud Run waiting for an instance.
- Boot’s OpenTelemetry starter exports metrics too. Its OTLP metrics registry is on by default and aimed at
localhost:4318: left on, every service logs a failed export once a minute. The defaults switch it off. - Trace storage provisions itself, in
us. Spans are stored in a_Tracebucket created about two minutes after the project’s first span, in theuslocation by default. If the location matters, create it first.
From a Tracer in every signature to one annotation
Here is what a traced method looked like before, condensed from a real service and renamed :
// in main() : register the exporter, in every serviceStackdriverTraceExporter.createAndRegister(StackdriverTraceConfiguration.builder().build());
// in the controller : a static tracer, handed down to the code that tracesprivate static final Tracer tracer = Tracing.getTracer();
// in the service : the tracer as a parameter, a span and a sampler per methodpublic Page<Order> getOrders(OrderParams params, Tracer tracer) {  try (Scope scope = tracer.spanBuilder("get/ordersList")      .setSampler(Samplers.alwaysSample()).startScopedSpan()) {    tracer.getCurrentSpan().addAnnotation("Find in MongoDB");    // ... the business code  }}
And after :
@Observed(name = "orders.order.get", contextualName = "orders.order.get")public Page<Order> getOrders(OrderParams params) { // ... the business code}No exporter in main(), no Tracer in a method signature, no sampler per span : the HTTP request, the MongoDB calls and the export come with the dependency. Measured on the code still to be migrated, the before is not a caricature : 47 services build spans by hand, 138 of them under 133 different names in at least five styles (get/ordersList, getOrdersList, OrderService/getOrders, a URL path…), and 36 register the exporter in main().
The name is the platform’s business too. Among the conventions every migrated service runs as ArchUnit tests, two are about spans : every public method of a @Service is @Observed, and every @Observed declares a name, in the fleet’s <domain>.<entity>.<verb> form. A method without a span, or a span without a name, fails the build. The demo keeps it short, and these checks would reject it : OrderService’s @Observed names no span, and pricing.quote and pricing.vat have two parts, not three.
The numbers
At work the same design ships in the fleet’s shared Spring library, on Java 21 and Spring Boot 3.5. As of 2026-10-08 :
- 49 of the 79 Spring Boot services build on the new parent, and with it send traces to Cloud Trace and logs to Cloud Logging, with no Google Cloud code of their own
- May 2026 : tracing on Micrometer and OpenTelemetry, one stack instead of two. September : the export moved to plain OTLP, in one library release
Cloud Trace shows the difference. On the development project, over the thirty days to 2026-10-08 :
- 2,493 spans from the old stack, not one carrying the name of the service that sent it, so Cloud Trace cannot filter them by service
- 13,763 spans from 33 services on OpenTelemetry, every one under its service’s name. In the 23 services on the library, the HTTP and MongoDB spans are named by Spring Boot (
http get /orders/v1/orders/{orderId},orders.find), and 7,059 of their 7,110 own spans follow<domain>.<entity>.<verb>. The services outside it keep the old styles, and one reports itself asunknown_service:java
That last pair is the one I care about. Forty-nine services send their traces to Cloud Trace and their logs to Cloud Logging, and none of them integrated either. A service gets tracing and structured logs the day it moves to the new parent, with no telemetry step of its own, and the thirty still to migrate will inherit them the same way. One integration decision, made once, became the default for the fleet.
Try it yourself 🚀
- Clone
spring-gcp-observabilityand, with Java 25 and Docker, run./mvnw verify: the starter’s tests run against a real MongoDB, nothing leaves the build ./mvnw install -DskipTests,docker compose up -d, and start both services with their traces aimed at Jaeger :then follow one request atTerminal window export MANAGEMENT_OPENTELEMETRY_TRACING_EXPORT_OTLP_ENDPOINT=http://localhost:4318/v1/traceslocalhost:16686- With a Google Cloud project of your own,
./scripts/deploy.shthen./scripts/demo.sh: one request, then its logs and its trace terraform -chdir=terraform destroywhen you are done, everything else is in the README
Step 2, on a laptop, gives the same request as the Cloud Trace one above, in Jaeger : the same jars, no Google Cloud project and no token bean, only the OTLP endpoint changed. Eight spans instead of ten, since Cloud Run’s front end and its placeholder are not there.